🧪 Beta — We're making this up as we go, and so far it's going great. Probably. · Data updated daily · Accuracy: aspirational · Not financial advice, obviously
Updated daily · Squamish BC real estate  🚧 Beta · We're making this up as we go. You've been warned.

Find the undervalued
property before anyone else does

Condos and townhouses in Squamish — ranked by value, risk, and monthly carrying cost. Not just a listings feed. A decision engine.

Open the dashboard View top picks
Active listings
Median condo $/sf
Median TH $/sf
Best outlier score
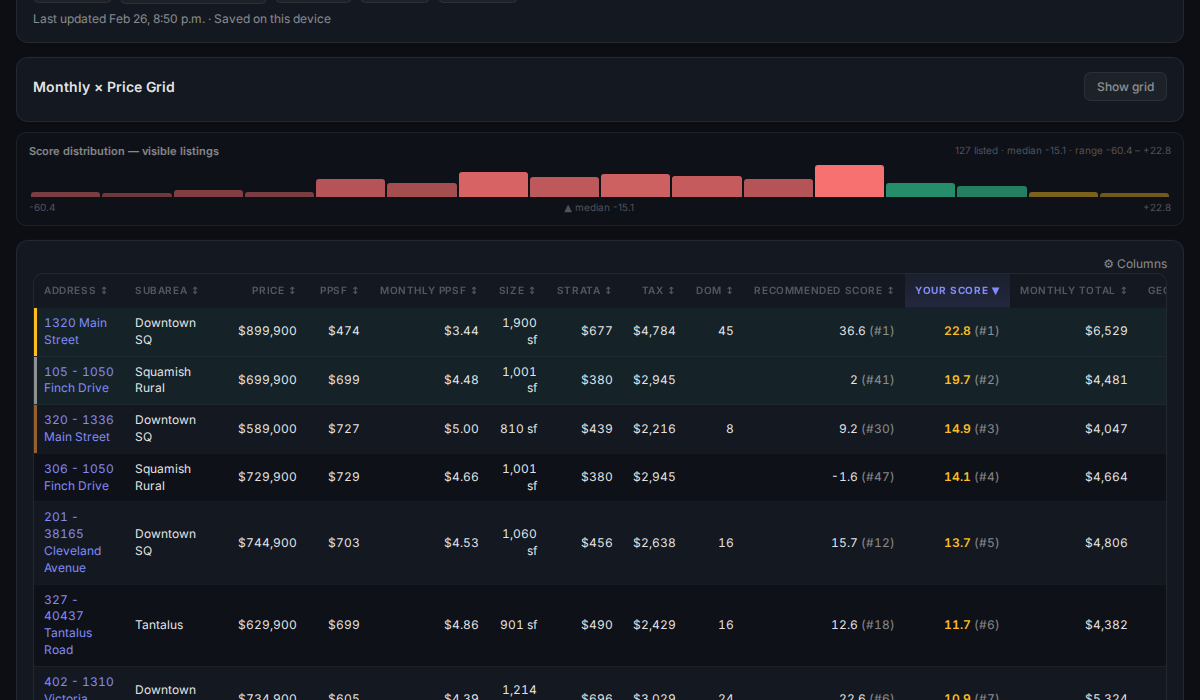
Scout dashboard showing ranked Squamish listings

The live dashboard → open it now

Today

Daily market analysis

Loading today's market analysis…
How it works

From raw listings to clear decisions

Scout scrapes, scores, and ranks every listing daily so you don't have to manually compare 127 properties.

1

Daily data fetch

Every morning, Scout pulls fresh listings from REW.ca and BCCondosAndHomes.com, updates sold prices, and flags new entries.

2

Score every property

Each listing is scored on value vs market ($/sqft), monthly carrying cost, strata efficiency, building age, size, and flood risk. No guessing.

3

Personalize your weights

Adjust the preference wizard to match your priorities — affordability, location, transit access, sun exposure, space preference.

4

Shortlist and visit

Star listings to build your shortlist, use the built-in checklist for visits, and get alerted when new high-score listings appear.

What you get

Built for serious buyers, not browsers

Every feature is designed to cut the noise and surface the properties worth your time.

📊

Outlier scoring

A multi-component score that weights value, carry cost, building risk, size, and flood exposure. Positive = interesting. Negative = avoid.

🔍

18+ filters

Filter by price, beds, baths, sqft, DOM, strata, tax, PPSF, monthly PPSF, monthly total, score, neighbourhood, and more — all paired min/max.

🏔

Neighbourhood intel

Each area comes with a real-talk write-up: flood risk, leaky condo era buildings, who it suits, what to watch out for.

📈

Score distribution

A live histogram shows how the visible listings distribute across score tiers — gold, green, and red — so you see the market shape at a glance.

Shortlist & visit checklist

Star properties to shortlist them, then open a structured visit checklist for any listing — designed to catch the things photos don't show.

🔔

Daily alerts

Set a score threshold and get Telegram alerts when new listings meet your criteria — before they get more expensive or disappear.

💰

Honest monthly cost

Every listing shows an estimated all-in monthly: mortgage P+I + strata + property tax/12 + repair reserve. Not just the mortgage payment.

⚙️

Personalized formula

Adjust the scoring formula weights directly — tune the importance of each component (PPSF, carry, age, flood, location) to match your real priorities.

🛡

Blacklist protection

Known problem buildings — leaky condos, flood zone addresses, bad strata — are blacklisted and never surface in results or recommendations.
Hall of shame

What did they smoke when they listed this?

The market's most aggressively optimistic sellers. These listings score worst in the dataset — not because of bad luck, but because the numbers just don't add up.

Loading the worst offenders…
Heads up

Too good to be true?

High scores don't always mean safe buys. These listings rank well on paper — but something in the data deserves a second look before you get excited.

Loading suspicious outliers…

Ready to find the deal?

Open the dashboard, set your filters, and let the score do the work.

Open dashboard → See top picks first Affordability guide